Secure. Traceable. Profitable: 380% ROI in Three Years – Plus €195,000 in Year One
OEMs and Tier-1 suppliers benefit on two levels: reliable data for audits and warranty claims, and measurable profitability from week six onward.
Objective in Context
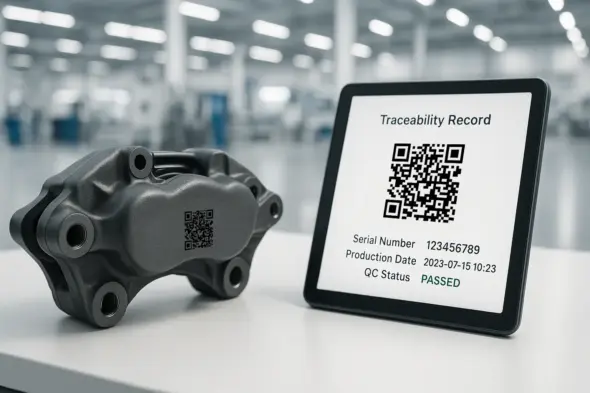
Ensuring full traceability of every safety-critical component reduces warranty and recall costs while strengthening protection against product counterfeiting. The combination of permanent laser marking and digital track & trace (assumption) provides OEMs and suppliers with reliable data to pinpoint root causes, assign warranty claims clearly, and deliver regulatory documentation without delay.
Scope & Level
End-to-end process—from inbound inspection to after-sales service – Sea-Level.
Stakeholders
Primary: OEM Quality Manager
Also involved: Production Manager (Tier-1), IT Administrator (MES/LIMS), Logistics Provider, Dealer Network (After-Sales) (assumption)
Trigger Event
A new production model enters pre-series phase; traceability audit by OEM requires component-level identification in <1 second (assumption).
Pre- / Post-Conditions
- Serial number logic released
- Laser system calibrated
- MES interface active
- Each component data record linked to inspection certificate
- Reports stored in QMS
- Counterfeit attempts reduced to <0.1%
Main Scenario
Quality manager generates serial number batch in MES.
Laser workstation engraves Data Matrix code in <0.3 seconds per part.
Vision system verifies readability and code accuracy.
MES links the code to production lot and material batch.
Components pass end-of-line testing; results are added to the data record.
Logistics scans the code at outbound; transport data is appended.
OEM assembly line scans the code at installation; vehicle VIN is added.
Dealer portal enables spare part authentication via smartphone scan (assumption).
In case of a recall, QMS filters affected VINs within 15 minutes and generates recall packages.
Analytics dashboard highlights failure trends and deviations.
Warranty departments cross-check claims with component lifecycle data.
Quarterly review sets KPIs for process optimization and maintenance planning.

Component Lifecycle – Sequence Diagram
Alternative / Exception Paths
Automatic rejection step; re-marking triggered
MES blocks the part and notifies Quality Assurance
Buffer mode: local database stores up to 8 hours of data
Key Performance Indicators (KPIs)
| KPI | Target | Baseline | Category |
|---|---|---|---|
| Recall Containment Time | < 15 minutes | 3–5 hours | Efficiency |
| Warranty Cost per Vehicle | –5% annually | Based on €0 | Cost |
| Counterfeit Incidents | < 0.1% | 0.5% | Quality |
| Scan Error Rate | < 0.05% | 0.3% | Process |
ROI Calculation
| Year | Gross Savings (Recalls ▼, Warranty ▼, Counterfeits ▼) | Ongoing Costs (Maintenance + License) | Net Benefit | Cumulative Cashflow | Cumulative ROI |
|---|---|---|---|---|---|
| 0 | – | – | –€325,000 (CapEx: Laser €250k, Software Integration €60k, Training €15k) | –€325,000 | 0% |
| 1 | €550,000 | €30,000 | +€520,000 | €195,000 | 60% |
| 2 | €550,000 | €30,000 | +€520,000 | €715,000 | 220% |
| 3 | €550,000 | €30,000 | +€520,000 | €1,235,000 | 380% |
Key Assumptions
The annual gross savings are based on:
€300,000 savings in recall costs (60% reduction in recall volume)
€200,000 lower warranty expenses (-5% on €4 million warranty volume)
€50,000 saved through counterfeit prevention and reduced rework
Ongoing costs: €20,000 per year for maintenance + €10,000 per year for software licensing
Payback period: Less than 1 year (~7 months)
Interpretation
A positive cashflow of €195,000 is achieved in the first year of operation. After three years, the cumulative ROI reaches approximately 380% – significantly outperforming the typical 24-month payback target for industrial investments.
Note: All figures are conservative estimates. Actual results may vary depending on production setup, equipment, and supply chain factors.